Dashboards, Analytics and Reports
Dashboards
CIGNON Dashboards is a module to build and display real-time business metrics.
CIGNON Dashboards provides you to stay in control of your business information with a total insight of most important data and metrics.
CIGNON Dashboards are online/real time generated based on the CIGNON database, eliminating additional tasks like, download, calculating and formatting data in other applications.
Cignon V3 Homepage supports a configurable Dashboard with several panels displaying reports and shortcuts to processes and entities.
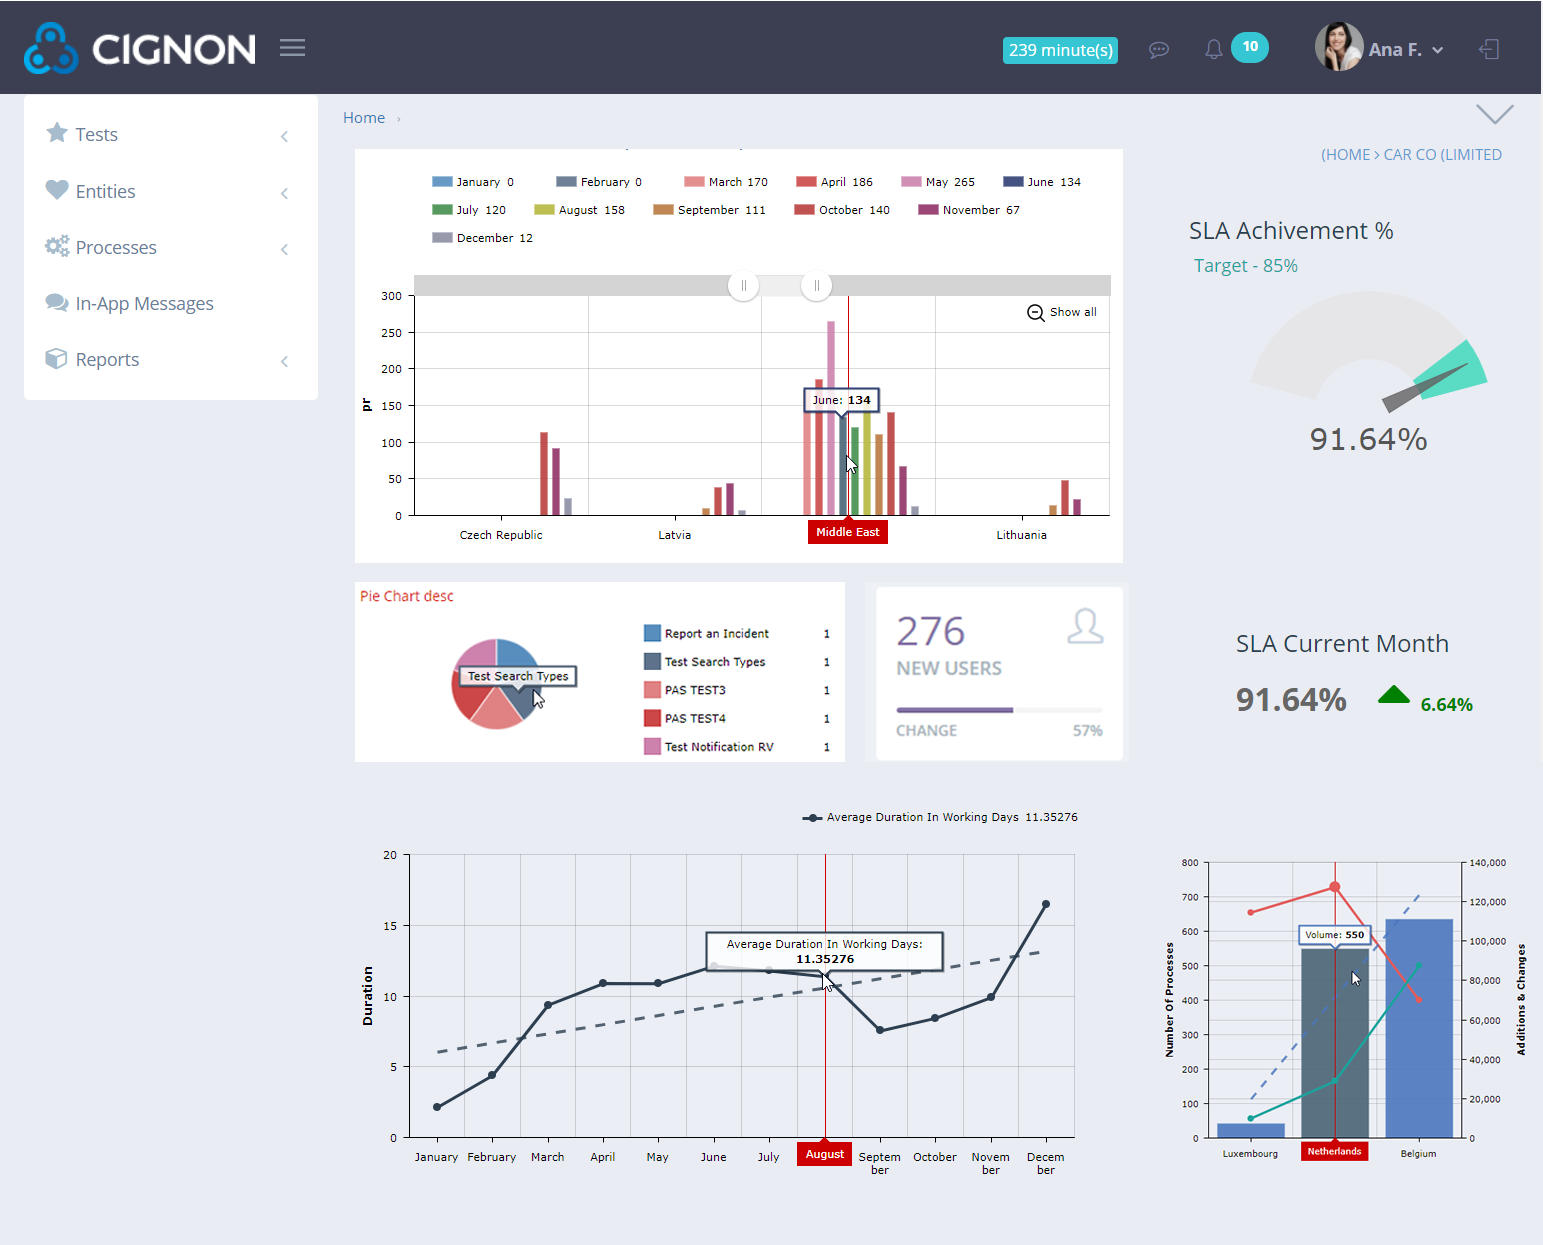
- Dashboards often provide an at-a-glance view of KPIs (key performance indicators) relevant to the business (e.g. sales, marketing, human resources, or production) and alerts the user when something is in need of action.
- Cignon V3 Dashboard is an easy to read, often single page, real-time user interface, showing a graphical presentation of the current status (snapshot) and historical trends of an organization’s key performance indicators (KPIs) to enable instantaneous and informed decisions to be made at a glance.
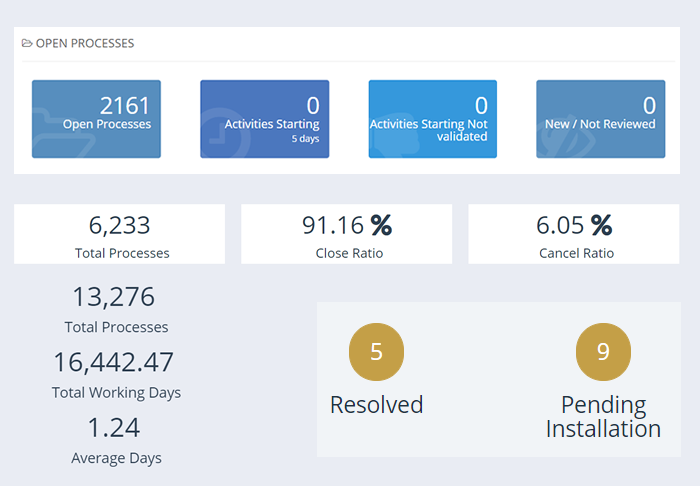
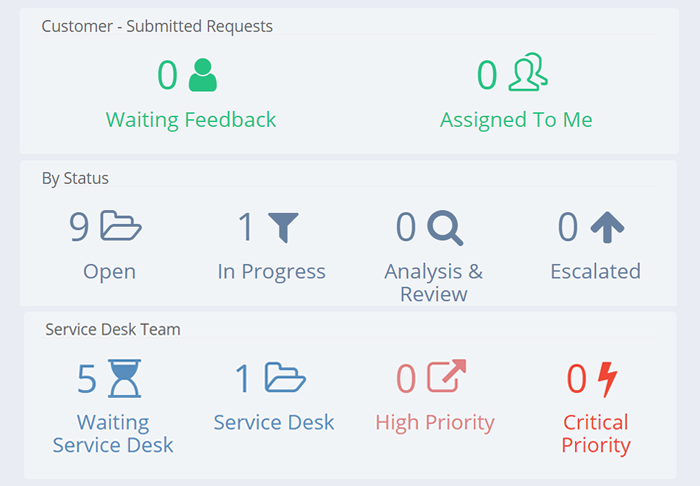
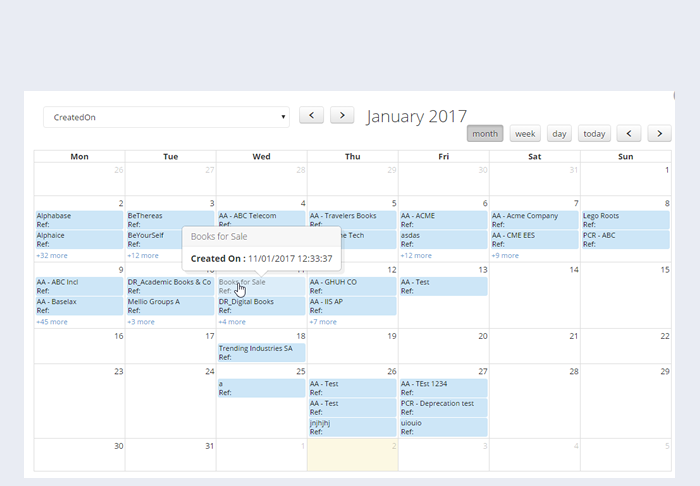
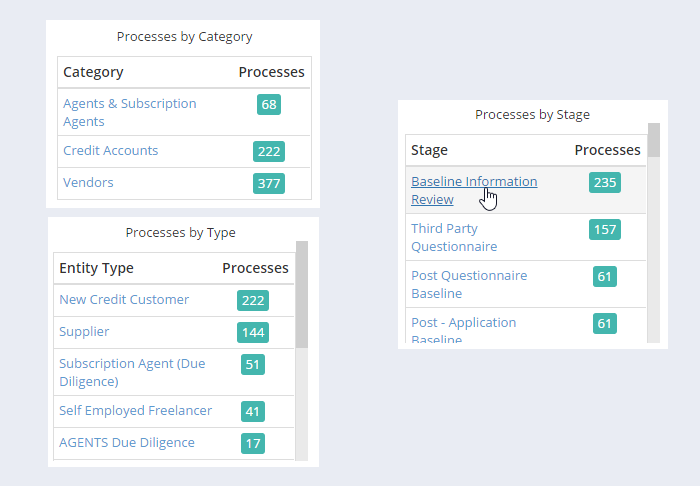
- This information can be displayed as panels, lists, highlights, counters, charts, calendar, etc, depending on the type of available data and entities.
Reports & Analytics
Reports and predictive analysis in a business process management solution help businesses improving existing processes, forecast market behavior, identify customer expectations, and increase overall profit margins.
In essence, great reporting features on a business process management tool means that you can tell better stories about how your processes are actually improving. Without good reporting, you won’t be able to impress business leaders who need to immediately see the value in a BPM solution.
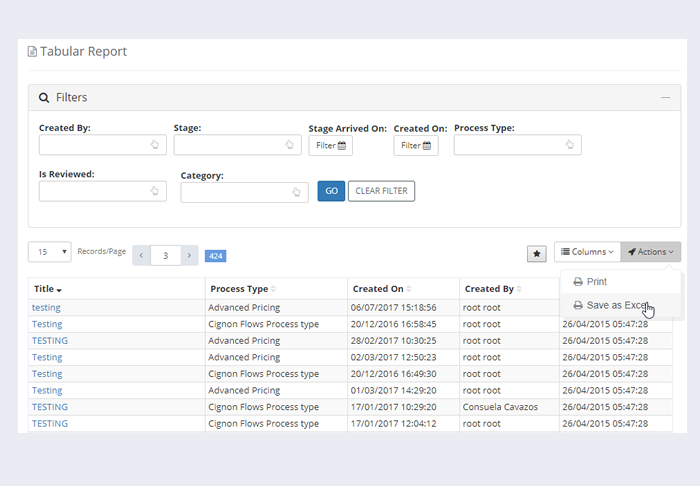
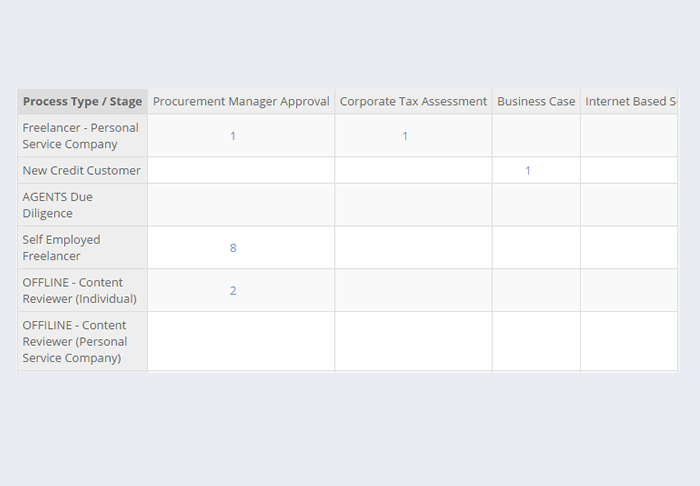
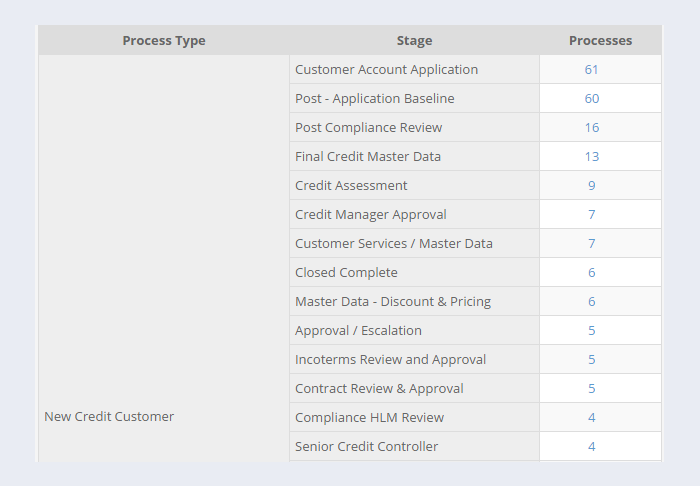
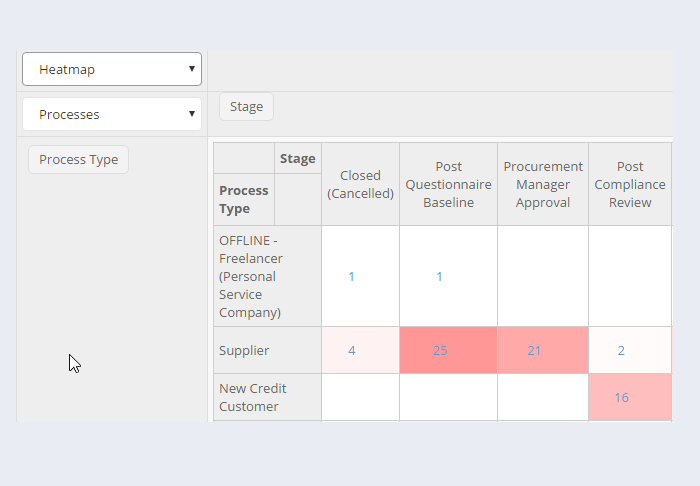
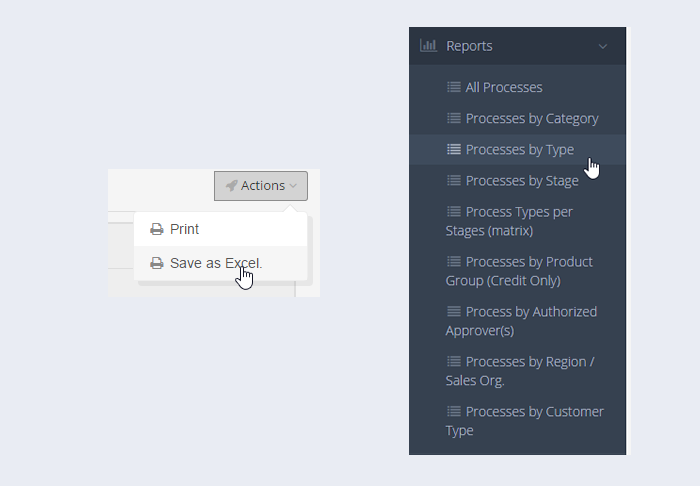
- Report Types: Tabular, Summary and Matrix
- Real time filters
- Export results to excel format
- Advanced mode (Summary and Matrix report) – Pivot Table
- Report individual access can be limited by role
- Menu and submenu item links to reports
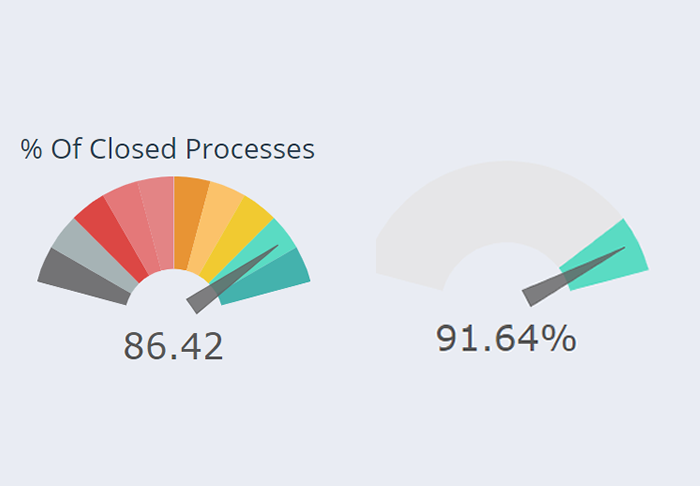
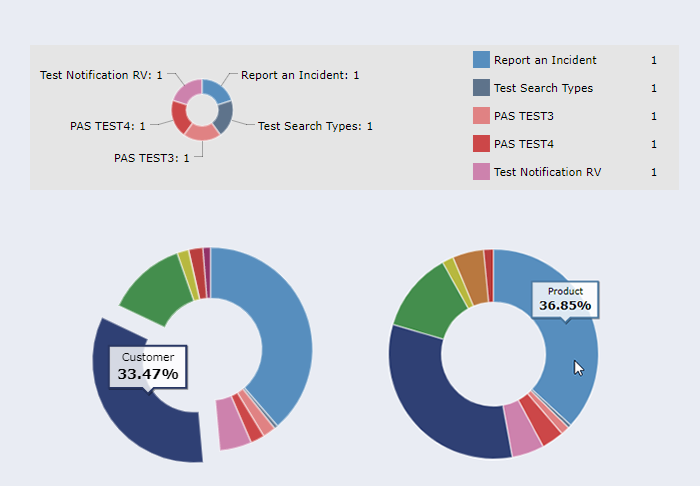
Dashboard Element Types
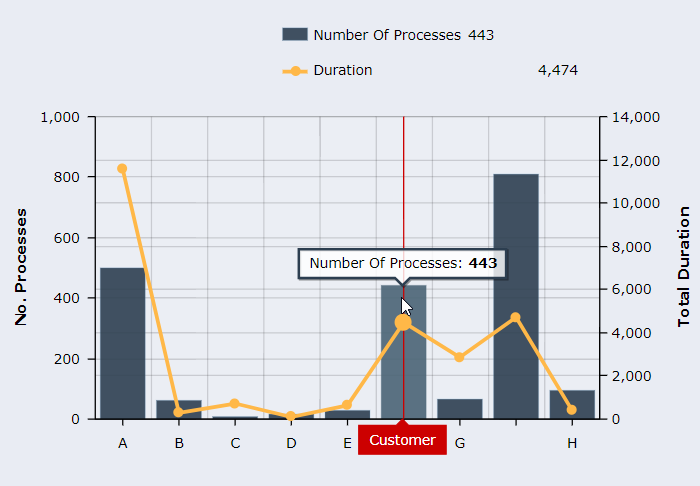
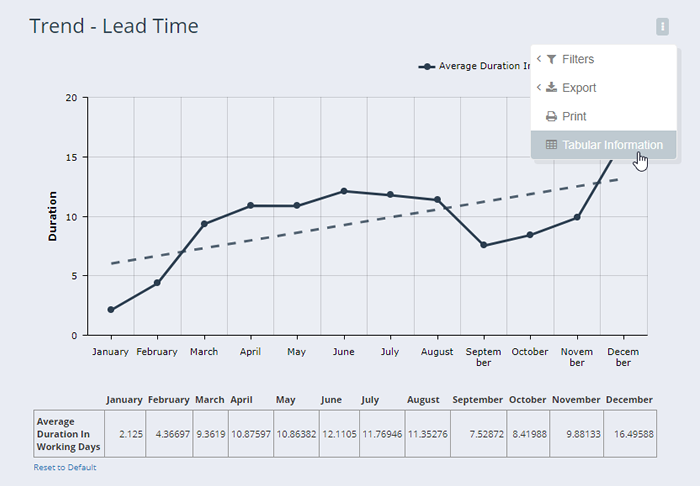
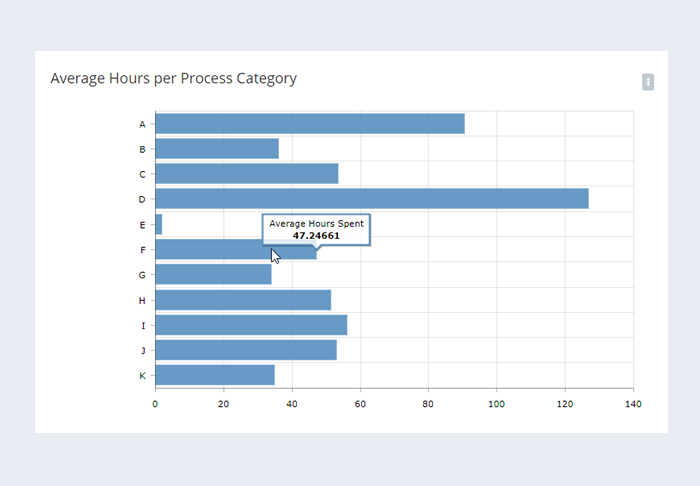
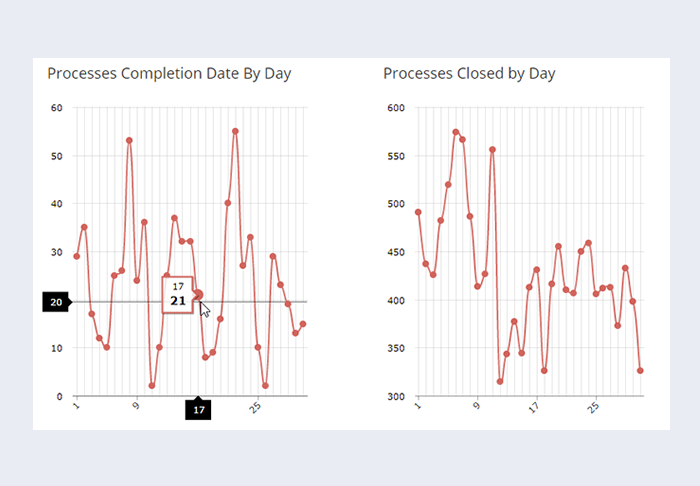
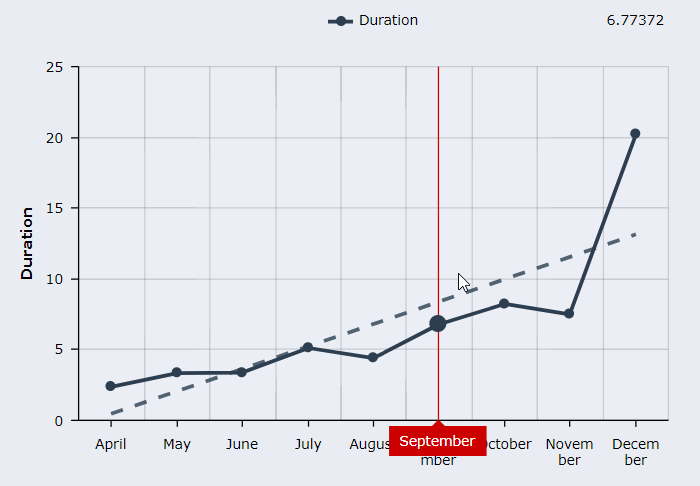
- Line Bar Chart
- Pie Chart
- Gauge
- Comparator
- Report
- Counters
- Entity Information